A polar diagram is a compact way of graphing the relationship among 3 or 4 variables. Also know as polars, VSK provides for up to 10 types for each sail configuration per boat however, accessing these polar diagrams is not straight forward. Colored curves on each polar describe a single performance metric as a function of some angle while one or two ambient conditions (a.k.a. parameters) remain constant. Wind speed and the difference between optimal and current sail angle are the most common fixed parameters identified by color-coded curves.
You really don't need to study polar diagrams to sail the 4 boat models that come with the installation of the VSK game client. Consider this information as advanced research for the curious mind. If you do choose to study the polars then you will realize that much of the intuition you developed as a result of frequent sailing a particular boat will be reinforced by the hard data graphed in these colorful diagrams.
- Tips
- As you first begin to study these, do not switch from mono-hull to multi-hull too frequently. The differences are dramatic and may lead to confusion for the novice.
- If the comments on a 3rd party boat model mention that manual sail trim affords an advantage over automatic sail trim then it is worth while studying the polar diagrams for that boat model to best understand the sweet spots.
Types of data[]
There are up to 4 head-sails as well as the option of sailing with no head-sail. Therefore, there may be 5 polar diagrams graphing each function described below. The three functions indicated by ** are not currently displayed.
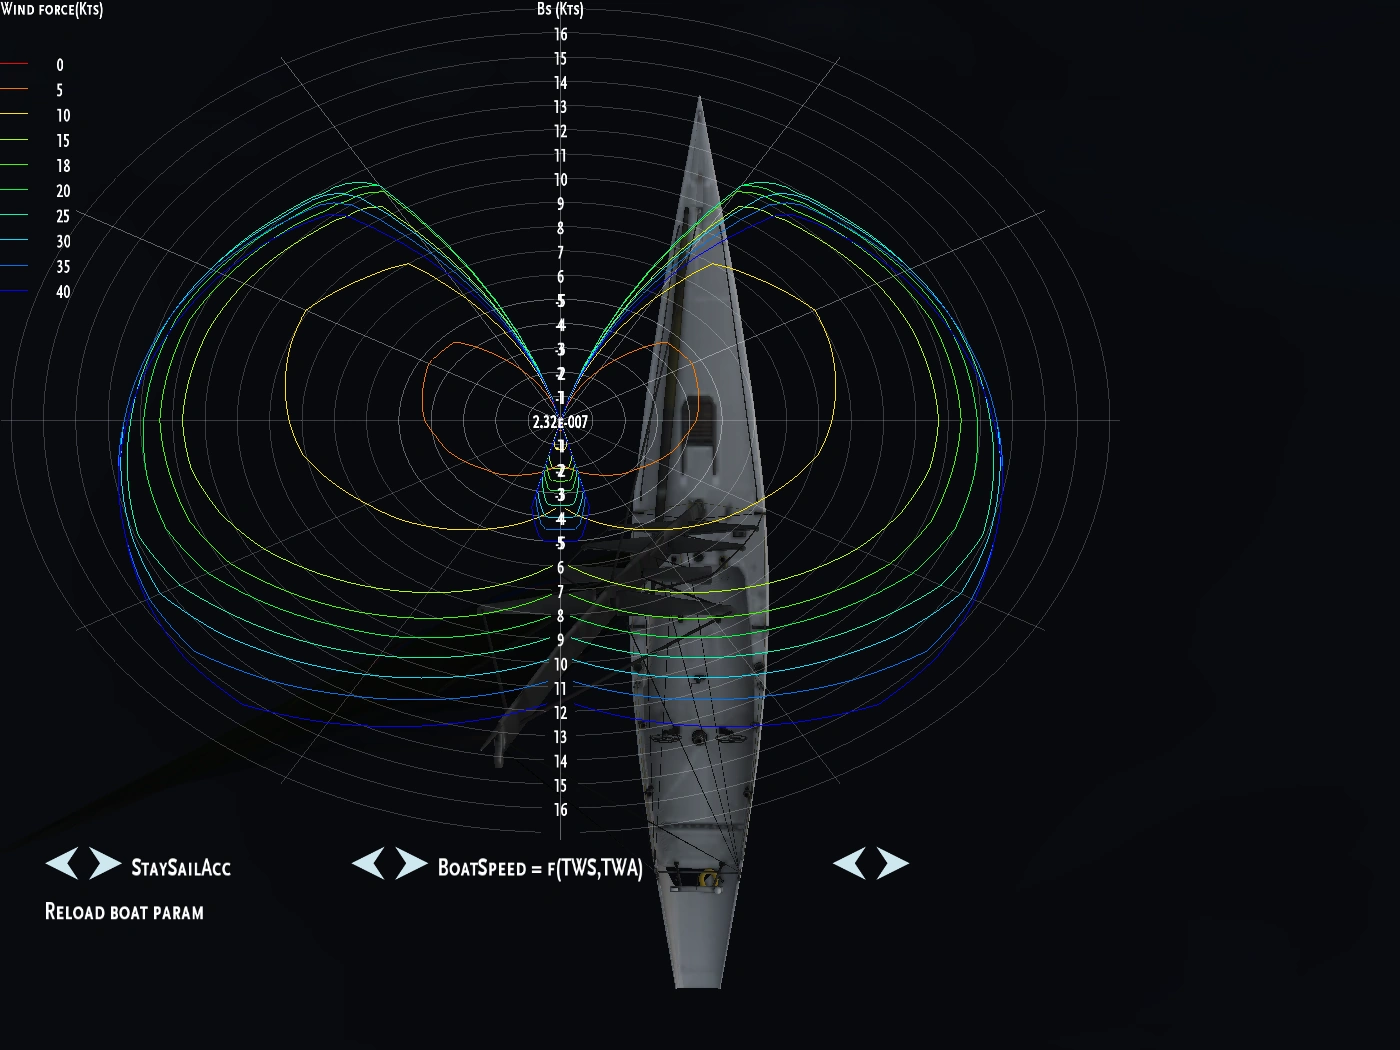
- BoatSpeed = ƒ( TWS , TWA )
- Boat speed as a function of true wind speed and true wind angle.
- HeelAngle = ƒ( TWS , TWA )
- Heel angle as a function of true wind speed and true wind angle.
- HeelAngleCoef = ƒ( TWS , AWA , (OptimalSailAngle - CurSailAngle) )
- Boat speed as a function of true wind speed, apparent wind angle and the current deviation from optimal sail angle.
- ** LuffAngleSpeed = ƒ( TWS , TWA )
- Luff angle as a function of true wind speed and true wind angle.
- RevolveAngleSpeed = ƒ( BS , TWA )
- Revolve angle speed as a function of boat speed and true wind angle.
- OptimalSailAngle = ƒ( TWS , TWA )
- Optimal sail angle as a function of true wind speed and true wind angle.
- Acceleration = ƒ( TWS , TWA )
- Acceleration as a function of true wind speed and true wind angle.
- ** ShiverAngle = ƒ( TWS )
- Shiver angle as a function of true wind speed.
- ** BoomAngle = ƒ( TWS , TWA )
- Boom angle as a function of true wind speed and true wind angle.
- BSCoef = ƒ( TWS , AWA , (OptimalSailAngle - CurSailAngle) )
- Boat speed coefficient as a function of true wind speed, apparent wind angle and the current deviation from optimal sail angle.
Interpretation[]
BS=f(TWS,TWA)
The value on the left hand side of each equation is plotted as the distance from the center of the polar diagram along a radial line. The angle of that radial line is always the angle described by the last (bold) argument to the function. The locus traced by these points while the other 1 or 2 parameters is held constant appears as a color coded curve where the color corresponds to the unchanging value of the fixed parameter(s). A table in the upper left lists the fixed parameter values for each colored curve.
Viewing[]
You cannot access the polars from within the multiplayer race mode or the normal solo race mode. You must first access the VSK Editors menu item to view polar diagrams. This means that if you only have the de-featured VSK5Online game client then you will not be able to view these boat performance curves.
- Before entering the race editor, from the main menu visit the settings page and view the inputs configuration pages. On page 1/3 note the key binding for ViewBoatCurves - the default binding is the 9 key but you may have remapped it or even unbound it altogether since it serves no useful function in normal race modes.
- Now return to the main menu; select editors then either edit a race or create a new race to open the race editor.
- Click on the params button in the top right just below a compass rose and verify that the boat of interest has been selected.
- If you are creating a new race to do this then you must first place a minimum of
- a start line
- a finish line
- spawn points for 4 boats
- Only then can you click the play! link at the bottom left of the editor window. Your boat will appear on the water.
- Now press the 9 key or whatever key you bound ViewBoatCurves to.
There are three pairs of left/right arrow buttons on screen. From right to left these perform the following select operations:
- select any of 5 sail configurations
- select any of 10 functions
- select all or a subset of the performance curves - note the color coded legend at top right as you step through those selections